Charts and visualizations
Many questions answer better as a picture than as a table. Exopen AI draws charts automatically when it helps, but you can also ask for a specific chart.
Chart types
- Line chart — change over time (revenue by month, margin by quarter)
- Bar chart — comparisons (revenue by region, EBITDA by cost centre)
- Horizontal bar chart — top lists (top 10 customers)
- Stacked bar chart — composition over time (cost types by month)
- Pie chart — share of a whole (revenue by product category)
- Donut chart — shares with a total in the middle
How to ask for a chart
Say which type you want or describe what you want to compare. The AI picks the type for you if you don't say.
"Show EBITDA by month for the last 24 months as a line chart."
"Top 10 customers by revenue 2024 as a horizontal bar chart."
"Show revenue by region 2024 as a pie chart."
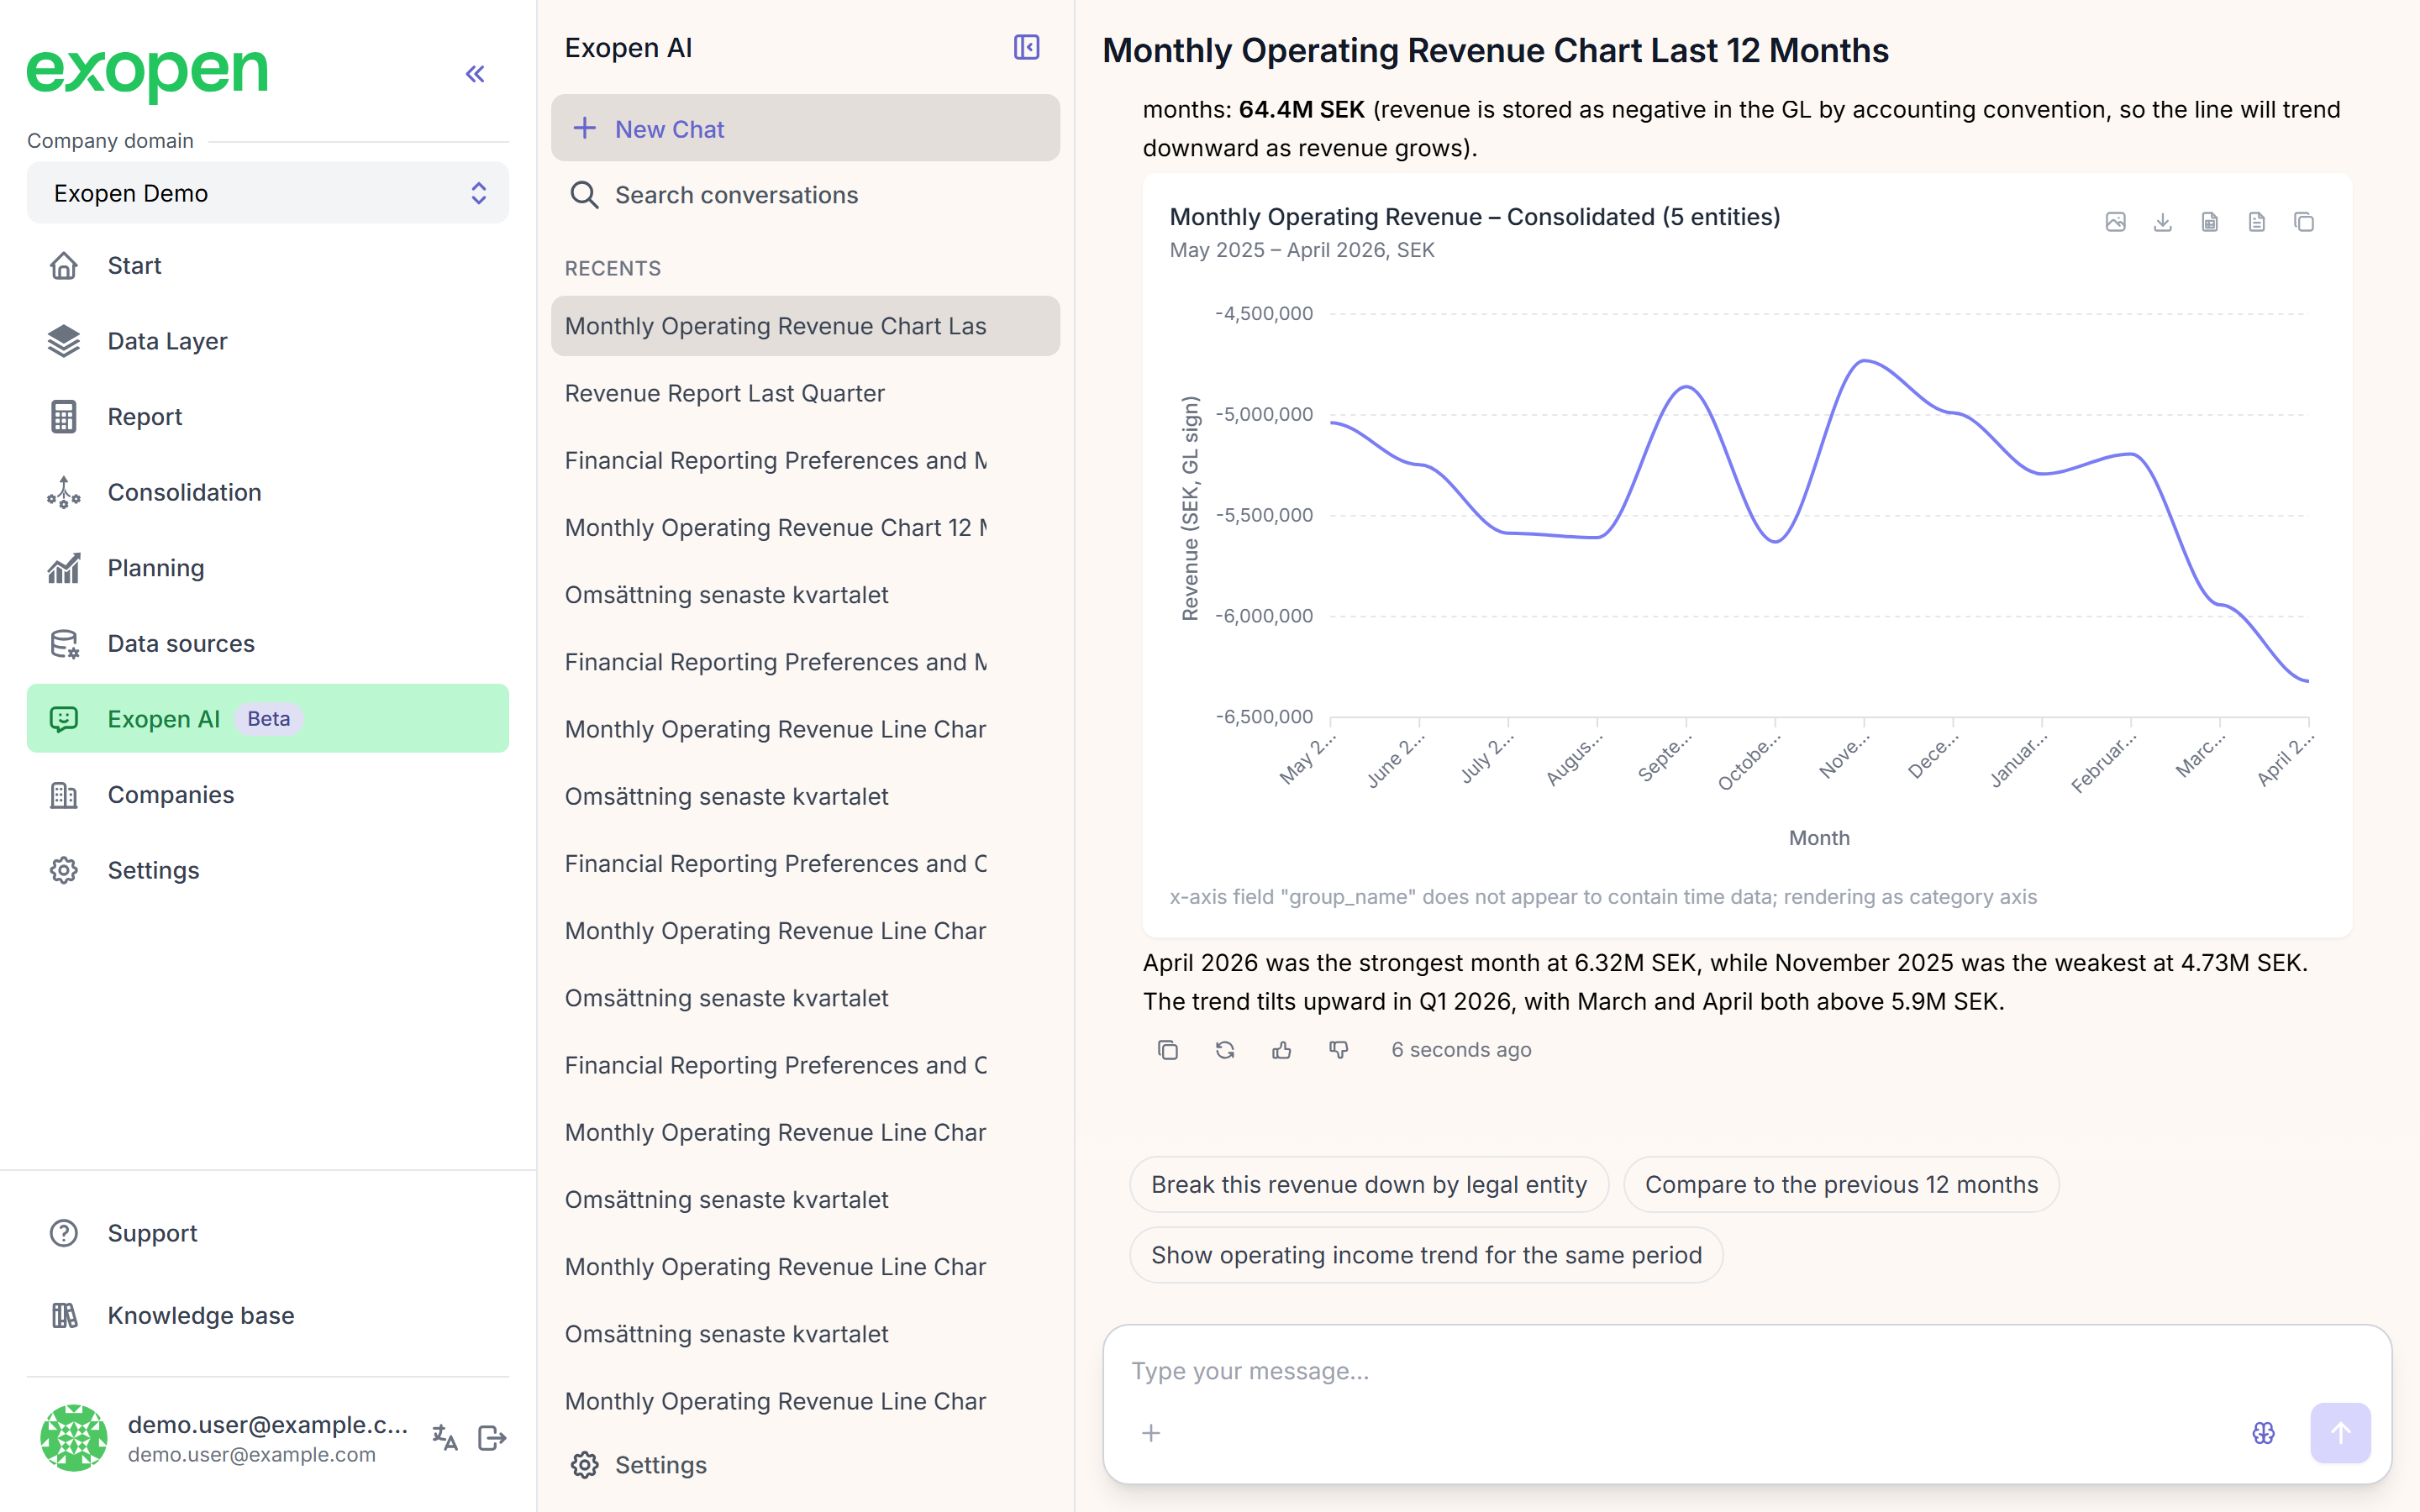
Example of a line chart with a text summary and follow-up suggestions.
Aggregations
When data needs to be summarised the AI can use:
- Sum
- Average
- Count
- Min / max
- Cumulative sum (growing over time)
Top-N and sorting
For top lists: explicitly ask for "top 10", "top 20", or up to "top 50". 50 is the upper limit.
Export
- You can copy the chart as an image straight into another application.
- Ask for CSV if you want the raw data: "Export this table as CSV."